October 14 update: the phase-two validation report records the later tests and the closeout of the current analysis line. The article below preserves the October 11 research snapshot; its proposed next experiments are historical plans, not active work.
Two stars orbit each other, periodically blocking part of each other’s light. An eclipse that arrives a few seconds early can carry information about an unseen companion. It can also reflect a dark patch on a star, an imperfect model, or an error introduced during data processing. A program can measure the shift precisely and still give the wrong physical explanation.
Eclipse Atlas is an independent astrophysics project built around that distinction. It uses Python and public telescope observations to measure eclipse times, test orbital models, and reassess published candidates for planets orbiting pairs of stars. The work connects software engineering to an unusually demanding application: using code as a scientific measuring instrument.
As of October 11, 2026, the project has produced measurements from real observations, simulation results, and models of stellar contributions to orbital changes. It has no independently confirmed new astronomical discovery. Its latest internal review recommends further validation before preparing a research paper.
Reading a clock made of two stars
An eclipsing binary is oriented so that, from Earth, one star periodically passes in front of the other. The deeper dip in brightness is usually called the primary eclipse; the other is the secondary eclipse. Their measured times can be compared with a schedule calculated from the orbital period.
Astronomers call this difference O−C: observed minus calculated. A train that arrives progressively later might need a revised timetable. A delay that grows and then shrinks suggests a different cause. Eclipse timing has the same distinction between a constant-period model, a long-term change, and a periodic offset.
An additional body can make the binary move toward and away from Earth, changing how long its light takes to reach us. The orientation of an eccentric orbit can also rotate gradually. This is called apsidal motion, and it changes the interval between primary and secondary eclipses. General relativity, tides between the stars, and stellar rotation all contribute.
Starspots and pulsations introduce another difficulty: they can change the shape of a brightness dip and shift its fitted center. A curved O−C plot alone cannot identify which process caused it.
Building a measuring instrument in Python
The main observations come from NASA’s TESS telescope. Its public archive provides light curves: brightness measurements indexed by time. Turning those files into a scientific result requires several kinds of computation.
The pipeline checks target identity, data source, and time conventions before selecting usable observations. It estimates background variations while protecting eclipses, treats products from different TESS processing teams separately, and includes exposure duration in the fitting model. Download manifests and checksums identify the inputs. Scripts, parameters, random seeds, and code versions record how a result was obtained.
Time conventions deserve their own checks. TESS timestamps use a specified reference point and time scale, with corrections for light travel within the Solar System. Comparing them with another observatory’s timestamps requires checking that observatory’s conventions as well. Eastman et al. describe how these differences affect precision astronomical timing.
Two measurement approaches—an empirical eclipse template and a symmetric profile fit—provide a comparison. The project also inserts signals with known answers and measures whether the program recovers them. Some experiments use simulated light curves; others test timing behavior against actual observational sampling.
For a software engineer, this adds a layer beyond ordinary automated tests. A unit test can check a formula or detect a regression. An injection experiment checks whether a measurement is biased and whether its uncertainty matches the errors it makes. A comparison with independently studied stars checks whether the method works on real physical systems.
Those checks can fail separately. Passing software tests does not establish that an astronomical interpretation is correct.
The first measured clock: TIC 1202347
The initial benchmark is TIC 1202347, also known as TYC 6579-659-1, an eclipsing binary with an orbital period of roughly 4.15 days. Thirteen downloaded TESS files cover seven observing sectors. One sector has no usable brightness measurements, leaving 57 measured eclipses from 2019 through 2025.
The empirical precision of an individual eclipse time is about 50 seconds. A joint fit across the observing baseline gives an orbital period of 4.15047376 ± 0.00000054 days. That small period uncertainty comes from combining many eclipses across several years; it is not the precision of a single timestamp.
Under the adopted models and uncertainty treatment, a constant orbital period explains the measurements. The 95% upper limit on a long-term period change is 0.13 seconds per year. A search over periodic timing models finds no significant periodic variation.
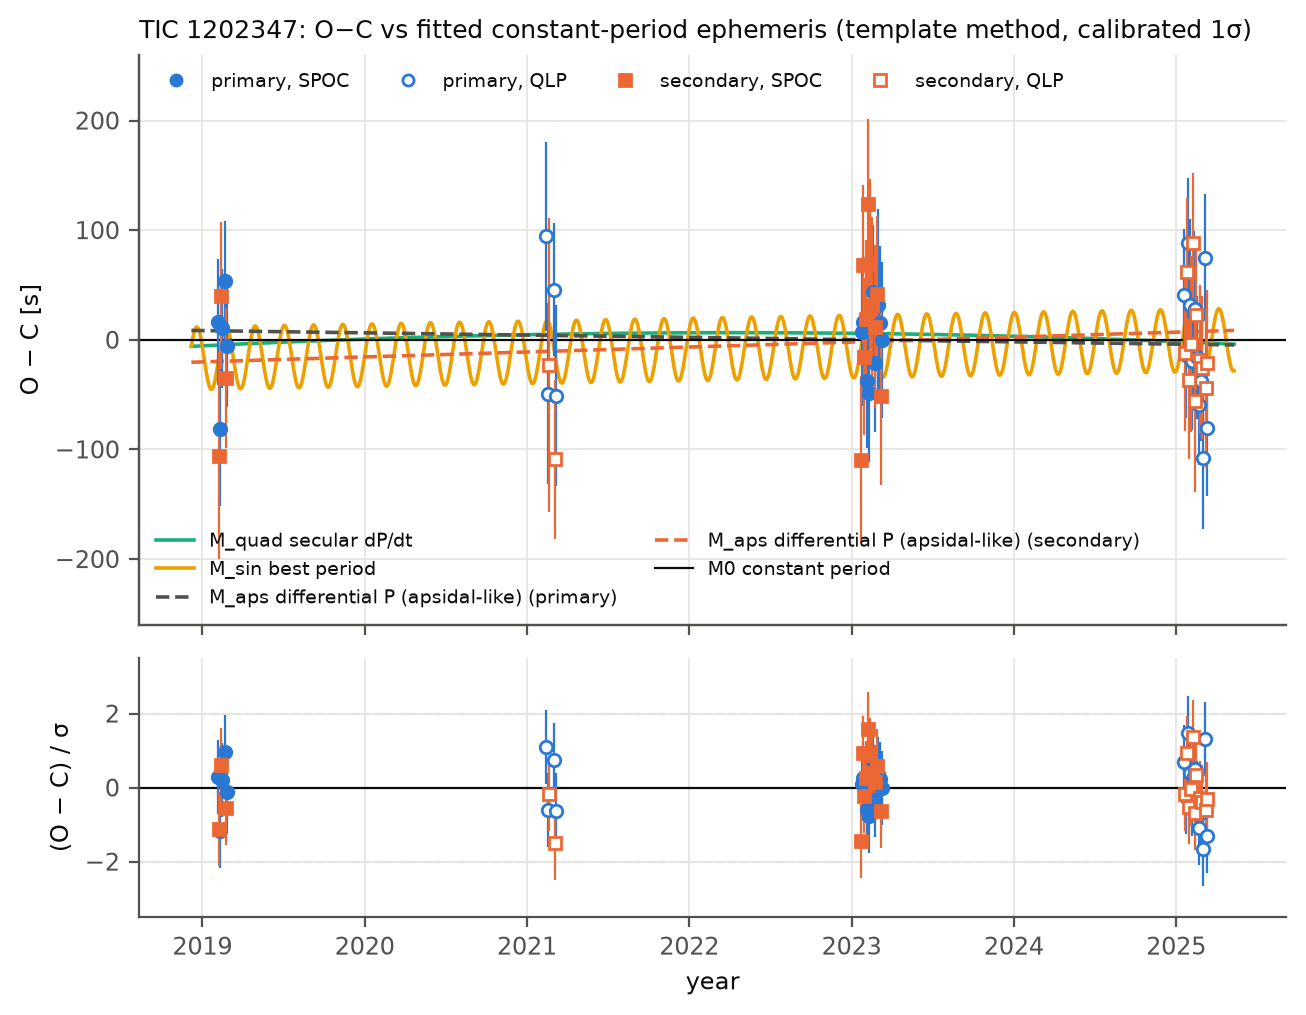
Figure 1. Blue and orange points represent primary and secondary eclipses. The panels show timing residuals and residuals relative to their uncertainties. The other curves are fitted comparison models; the oscillating orange curve does not meet the detection threshold. Observations fall into four groups of dates.
The gaps between those groups matter. They are roughly two years apart, leaving the analysis less sensitive to some periodic changes. Injection tests show that near a 700-day period, a timing signal with a 400-second semi-amplitude can be missed. A negative result constrains the signals that the available observations could have detected.
A smaller feature remains unexplained: the secondary eclipse arrives about 56 ± 18 seconds earlier than exactly half an orbital period after the primary. Slight orbital eccentricity or differences in eclipse shape could produce it. The project does not classify it as a new physical discovery.
Calibrating uncertainty and false alarms
Early validation exposed a problem familiar in data analysis: measurements collected in the same batch can share an error. Treating every eclipse as an independent observation can make uncertainty shrink too quickly.
The revised analysis combines eclipses within a TESS sector into timing nodes and allows additional variation between sectors. It examines both changes shared by primary and secondary eclipses and differences between them. These diagnostics help separate overall arrival-time changes from possible apsidal motion, although stellar activity still needs investigation.
The analysis rules were frozen before a set of 1,300 simulations. Among the 233 measurable simulations with no true differential drift, the procedure reported zero false drifts. The finite sample still permits a false-alarm rate of about 1.6% at the 95% upper confidence bound.
For the same 233 cases, a comparison estimator that treated individual eclipse errors as independent and applied a formal three-standard-deviation threshold produced false alarms in about 79% of cases.
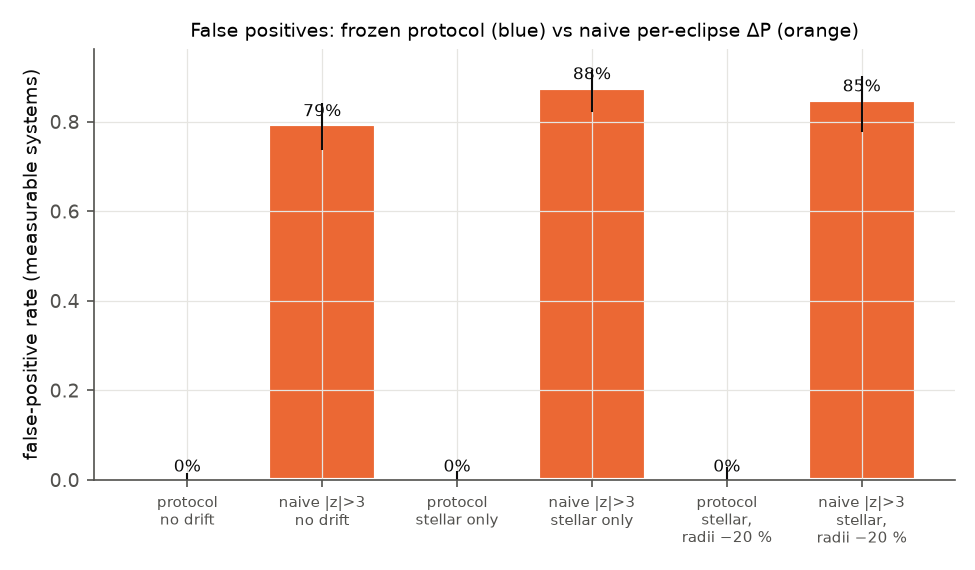
Figure 2. Blue bars show the frozen procedure; orange bars show the comparison estimator. Each percentage uses the measurable systems in its own simulation category as the denominator. These results depend on the simulated noise, sampling, and parameters. They do not establish the false-alarm rate of all real binaries or of another author’s analysis.
The conservative procedure also loses sensitivity. Of 227 measurable simulations containing extra apsidal motion, only about 23% met the significant-excess criterion.
TIC 172900988 has a planet confirmed through independent observations. With only three TESS timing nodes available to this project, it did not pass the project’s confirmation threshold. That failure identifies a limitation of the available data and method; it does not invalidate the confirmed planet.
An earlier attempt to reproduce published measurements also missed some predetermined requirements. Changes to the template center, uncertainty treatment, and signal filtering improved agreement. Because those changes followed inspection of the benchmark, the improved results still need a new independent test with rules specified in advance.
Reassessing 27 published candidates
Thornton et al. reported 27 candidate systems where measured apsidal motion exceeded their estimated stellar contributions. Their study also describes a degeneracy between the mass and distance of a possible companion and the need for follow-up observations.
Eclipse Atlas repeated timing measurements for all 27 systems. Twenty-five were evaluated under a blind-test protocol; two previously studied targets were treated separately as controls. The research lead authorized this stage after the limited detection performance had been recorded.
Four systems—ES Lac, V743 Cep, TIC 396170777, and TIC 196989952—showed significant differential timing drift. Drift alone does not establish an additional companion. Two others, TIC 253270207 and TIC 146204045, had reestimated rates below the published values. Explaining the disagreement requires individual eclipse timings from the original analysis and better orbital constraints.
The next computational stage fitted stellar sizes relative to the orbital scale directly from the light curves. Exposure-integrated physical models and sampling of parameter uncertainty were used to estimate contributions from relativity, tides, and rotation. Claret’s stellar structure grids supply internal-structure parameters needed for the tidal calculation.
Relative stellar radius has a large effect: with other parameters fixed, the relevant classical contribution scales with the fifth power of that radius. A 20% increase multiplies the contribution by approximately 2.49. This is a relationship in the equations, not a measured correction applied to every target.
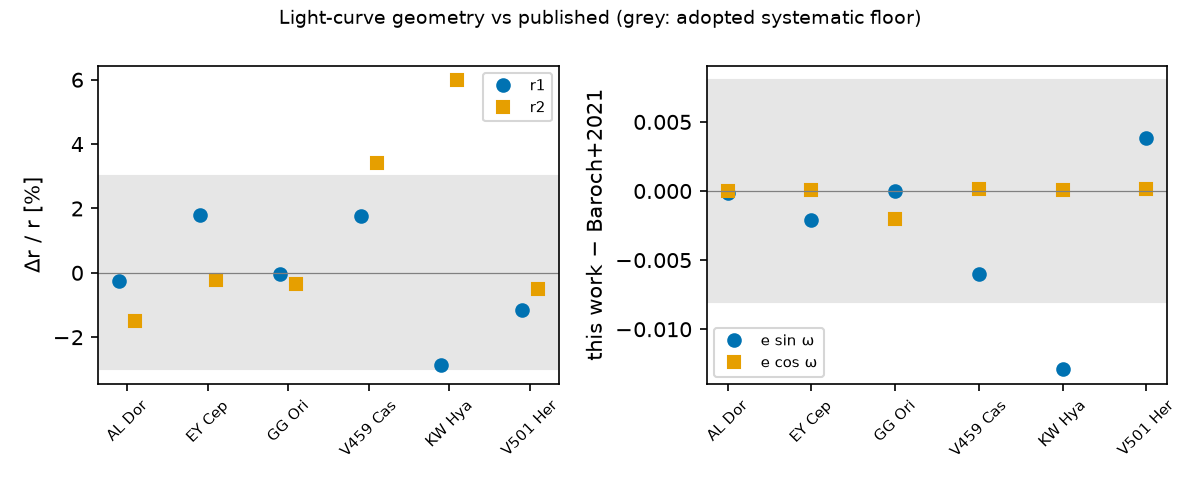
Figure 3. The left panel compares the relative radii of both stars; the right compares orbital geometry. Across the twelve components of six systems, relative-radius discrepancies have an RMS of about 2.3%, with the largest discrepancy about 6%. The gray bands represent adopted systematic-error floors; some points lie outside them. These figures do not guarantee the same accuracy for a new target.
Using the published apsidal-motion rates, the latest models classify the 27 systems as follows: seven are consistent with relativistic and stellar effects, seven retain a conditional excess under the tested stellar models, four are sensitive to assumptions, and nine have insufficient information.
The seven conditional excesses depend on the published rates and their errors. The project’s own timing analysis does not independently support an excess in any of those seven systems; one also had a rate disagreement in the earlier timing analysis. Calling them newly discovered planets would omit the required independent confirmation.
The next experiment needs a longer baseline
The project has progressed to measurement validation and physical modeling of candidates. Several requirements for a paper remain open: some masses depend strongly on stellar models, the timing procedure has not passed every independent validation requirement, and additional apsidal motion lacks independent observational confirmation.
Jiang’s 2026 preprint already examines stellar effects in CH Ind and SW CMa and checks radius requirements across the candidate sample. Eclipse Atlas adds measured relative radii and quantitative checks, but the overlap limits a claim of scientific novelty.
The next planned observations focus on TIC 146204045, TIC 293225466, TIC 196989952, and TIC 399127035. Over a ten-year baseline, the published-rate and stellar-contribution models predict differences of at least roughly 50 minutes in the primary-to-secondary eclipse interval. These are forecasts, not differences already measured in archival observations.
Testing them requires a timing method validated for sparse ground-based data, verified archive time conventions, and decision thresholds set before inspecting the outcome. Spectroscopy could constrain stellar masses, rotation, and possible companions. Access to the original individual eclipse times would help resolve the present rate disagreements.
Public telescope archives make these measurements possible on a personal computer. AI coding tools can assist with scripts and numerical checks. Deciding which comparisons are independent, documenting failed tests, and limiting a claim to its evidence remain scientific responsibilities. The next deliverable for Eclipse Atlas is an independent measurement capable of distinguishing the competing predictions.
Research snapshot: October 11, 2026, archived analysis commit 4d2cd05. All three figures are copied from the project’s original analysis outputs. The evidence and provenance appendix lists numerical sources, scripts, inputs, and limitations. The measurements and simulations reported here have not been peer reviewed as results of this project.